
Figure 2.
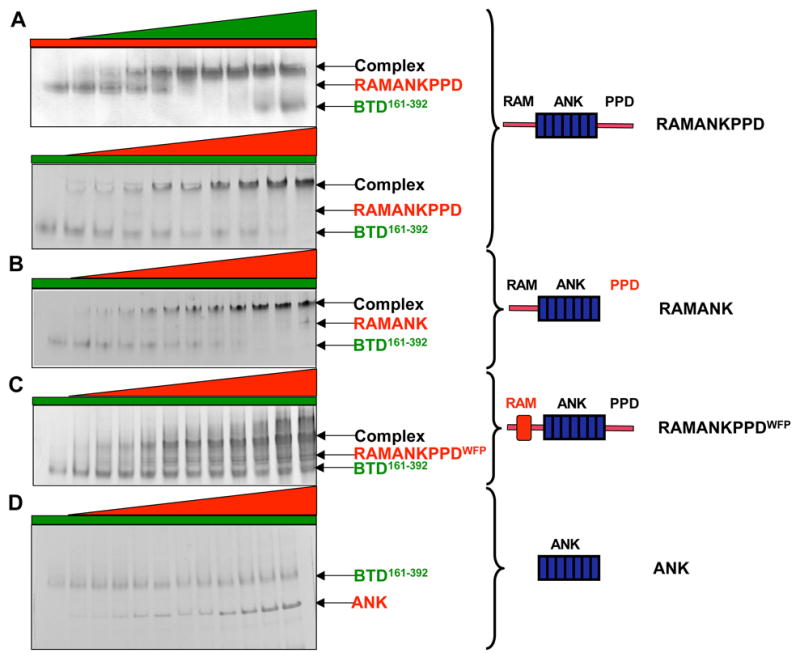
Monitoring complex formation using native gel electrophoresis. Increasing concentrations of different length Notch1 polypeptides (0, 2 μ M, 3μ M, 5μ M, 7μ M, 9μ M, 10μ M, 12μ M, 15 μ M and 20μ M) were titrated into 10μ M BTD161–392. (A) Upper panel: 10μ M of RAMANKPPD was titrated with increasing concentrations of BTD161–392; lower panel; 10μ M of BTD161–392 was titrated with increasing concentrations of RAMANKPPD. (B) 10μ M of BTD161–392 was titrated with increasing concentrations of RAMANK. (C) 10μ M of BTD161–392 was titrated with increasing concentrations of RAMANKPPDWFP. (D) 10μ M of BTD161–392 was titrated with increasing concentrations of ANK.