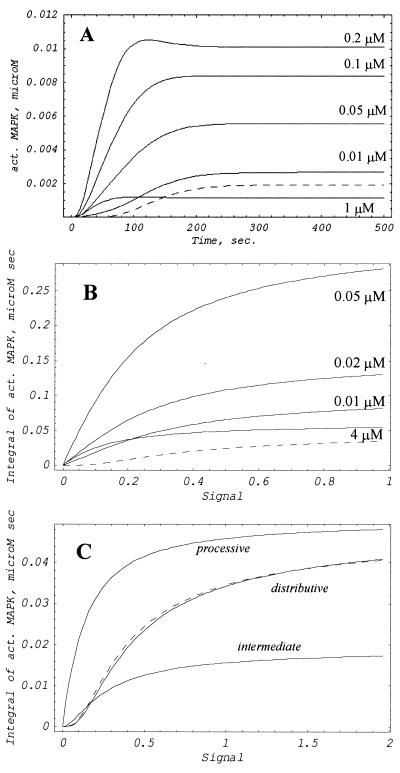
Figure 2.
The role of scaffold proteins in kinetics and input–output sensitivity of MAPK activation. (A) Kinetics of MAPK activation as a function of a two-member scaffold concentration. The scaffold concentrations considered are indicated in the figure. The dashed line represents the kinetics of unscaffolded reaction. (B) Dependence of MAPK activation on the level of signaling. For each scaffold concentration, the kinetics of MAPK activation was computed as in A, and integral over the first 100 sec was plotted as a function of the signal. The level of the signal corresponds to the concentration in micromolars of a MAPKKK activator. The dashed curve represents unscaffolded reaction. (C) Input–output relationships for various scenarios of reactions in the scaffold. The processive (all values are divided by four), intermediate, and distributive (multiplied by 108) reactions are considered (see details in the text). MAPK activation with no scaffold is presented by the dashed curve for comparison.

