Figure 3.
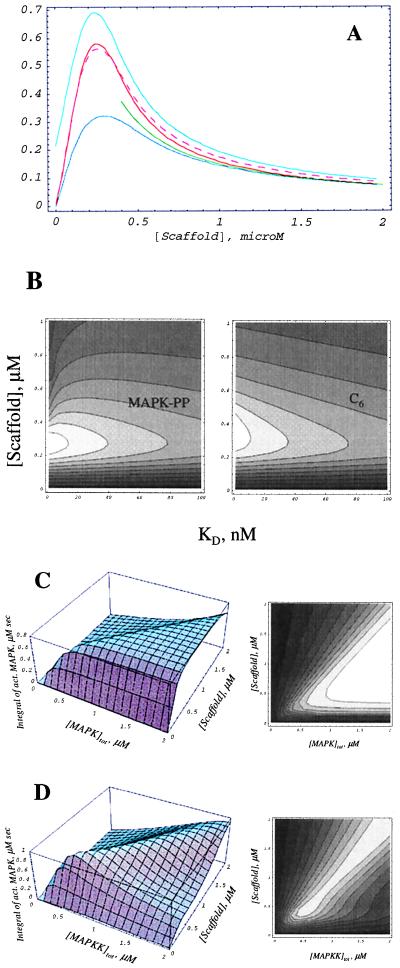
Existence of an optimal scaffold concentration. (A) Dependence of MAPK activation (red) and functional scaffold–kinase complexes C6 (blue) and C8 (dashed magenta) on the two-member scaffold concentration. MAPK activation at 100-fold lower MAPKK phosphatase concentration is shown in light blue. C6 is normalized by dividing by 40 and C8 by multiplication by 17 for better comparison and illustration purposes. The results are compared with the plot of 0.15/[Scaffold] (green). (B) The optimum of MAPK activation or C6 formation is not sensitive to the dissociation constant KD of MAPK–scaffold interaction. The lighter areas in the contour plots correspond to higher MAPK or C6 concentrations. (C and D) The optimal scaffold concentration (two-member scaffold) is a function of MAPKK (C) and MAPK (D). Both three-dimensional and contour plots of MAPK activation are shown.

