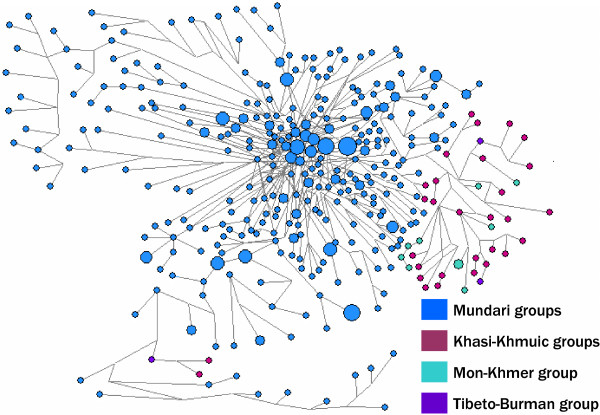
Figure 4.

Median-Joining network of Y-STR haplotypes of O-M95 haplogroup. Samples with data on some STRs missing were excluded and the remaining 564 chromosomes were analysed. Circles represent haplotypes with area proportional to their frequency. Microsatellite mutations are represented by black lines.
