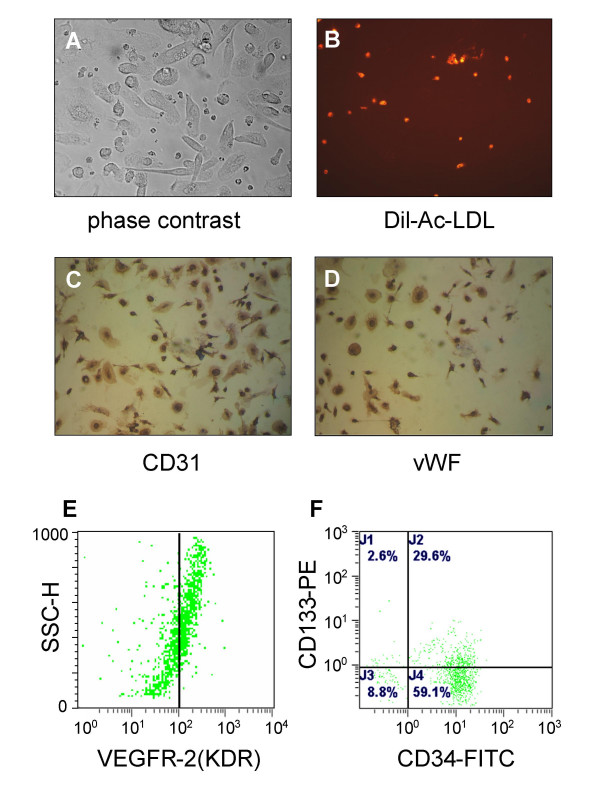
Figure 1.
Characterization of EPC. Isolated EPCs were visualized by phase-contrast microscope (A 400 ×), and DiI-Ac-LDL uptake was analyzed by fluorescent microscope (B 100 ×). The cells were further analyzed by immunostaining with anti-CD31(C 200 ×) and vWF antibodies(D 200 ×), or by flow cytometry with anti-KDR (E) and CD34/CD133 antibodies (F).

