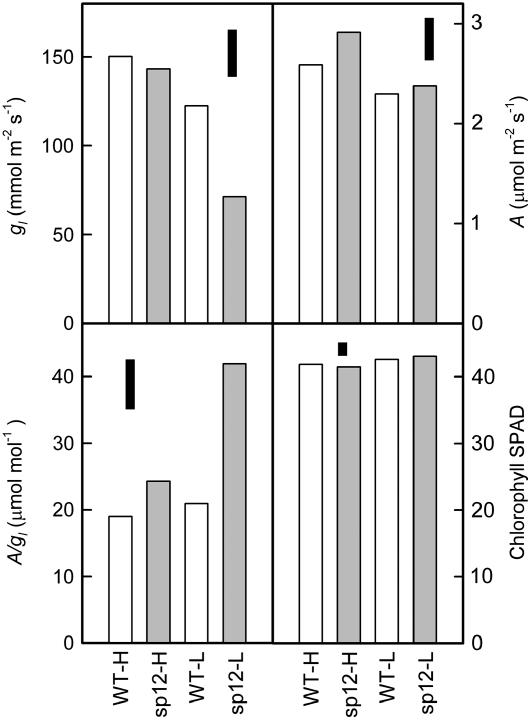
Figure 3.
Interaction between VPD and genotype for gas exchange. Plants were established at 65% RH and on day 0 were either left at low RH (L) or transferred to a high RH cabinet (88%–95% RH; H). IRGA measurements (n = 10 plant replicates) were taken on day 26, when plants had on average 14 leaves. A, gl, and A/gl are plotted. SPAD readings were taken on day 13 (n = 15). Floating black bars represent lsd (5%). White bars, Wild type; gray bars, sp12.

