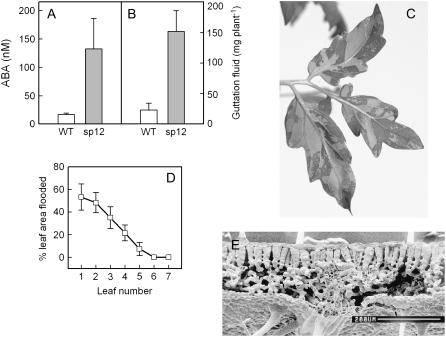
Figure 4.
ABA concentration of guttation fluid and flooding of intercellular spaces. Wild-type and sp12 plants were transferred from low to high humidity 2 d before collecting data. A, ABA concentration of guttation fluid (n =3); B, mass of collected guttation fluid (n = 5); C, typical symptoms of intercellular flooding for an sp12 leaf photographed under reflective illumination; D, incidence of leaf flooding in sp12 leaves, plotted by leaf position (leaf 1 is the lowest leaf, n = 10); E, freeze-fracture scanning electron micrograph of a wild-type leaf (bar = 200 μm). Error bars show single ses of the mean; n refers to number of independent plants.

