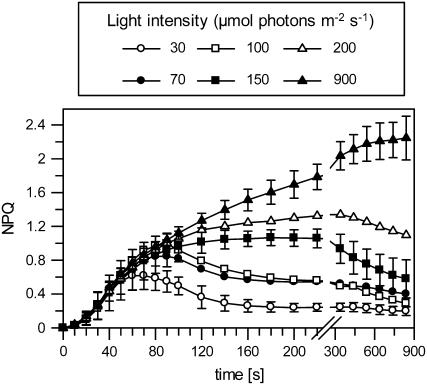
Figure 1.
Time course of NPQ formation in dependence on the actinic light intensity. Leaves from 4-week-old wild-type plants that were dark adapted for at least 10 h were illuminated for 14 min at different light intensities in the range from 30 to 900 μmol photons m−2 s−1 followed by dark exposure for 10 min. The dynamics of NPQ were derived from the maximum fluorescence induced by saturating light flashes at each of the measuring points. Mean values (±sd) of three independent experiments are shown. For clarity, sd is shown for only three light intensities but was in the similar range for the other intensities.

