Figure 2.
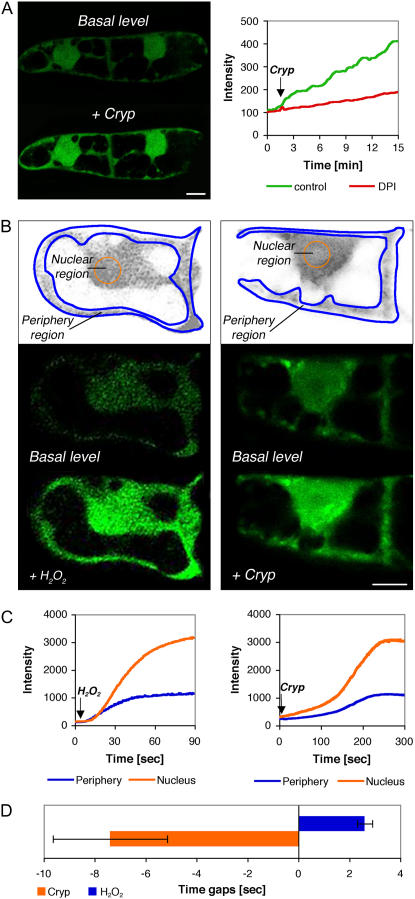
Subcellular accumulation of H2O2 in BY-2 cells after H2O2 and cryptogein addition as reported by DCF. A, Left inset, Optical section showing the DCF signal before and 13 min after the addition of 100 nm cryptogein. Right inset, Kinetics graph of response to cryptogein reported by DCF with or without the addition of DPI. B, Subcellular accumulation of H2O2. Left insets, DCF signal before and 75 s after external addition of 0.1 mm H2O2. Right insets, Image of DCF signal before and 5 min after addition of 100 nm cryptogein. Top insets in B, Division of the cell into periphery (blue line) and nuclear (orange line) regions. Scale bar in bottom right image = 10 μm. C, Kinetics graphs of signal intensity after H2O2 (left inset) and cryptogein (right inset) application. DCF signals were recorded from the designated periphery and nuclear subcellular compartments as shown in the top insets of B. D, Maximal rate of signal acquisition as measured in the periphery or nucleus expressed as the time gap. The time to achieve maximal rate of signal acquisition was measured in each compartment. The difference in start times was calculated as described in “Materials and Methods.” Negative values were defined when the nuclear compartment reacted before the periphery compartment. Averages of five experiments ± se are shown.

