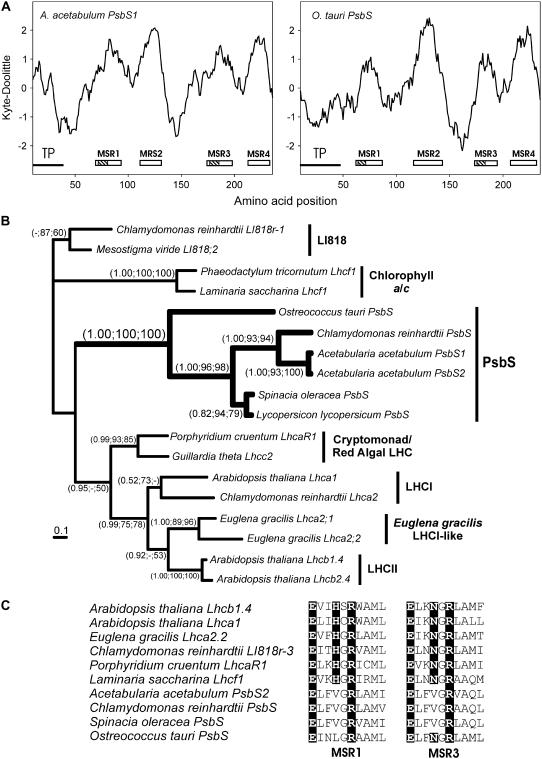
Figure 3.
Analysis of green algal PsbS proteins. A, hydrophobicity plots of A. acetabulum PsbS1 and O. tauri PsbS sequences calculated with a window size of 19. Putative transmembrane regions are indicated by a white rectangle. Hatched areas identify the location of the putative Chl-binding motifs. TP denotes transit peptide location as determined with ChloroP. B, Phylogenetic analysis of PsbS sequences. A total of 120 amino acid positions were analyzed and the proportion of invariable sites was 0.113. The average sd of the split frequencies was 0.0015. A MrBayes tree is shown with the support values for all three phylogeny programs shown at specific nodes (MrBayes, ProtDist, and PHYML). The γ shape distribution parameter (α) was 4.123 and the −lnL value of the best PHYML tree was 3621.81. C, The conserved Chl-binding motifs for both MSR1 and MSR3 are shown for a variety of LHCs and organisms. The conserved residues in LHCs are highlighted.

