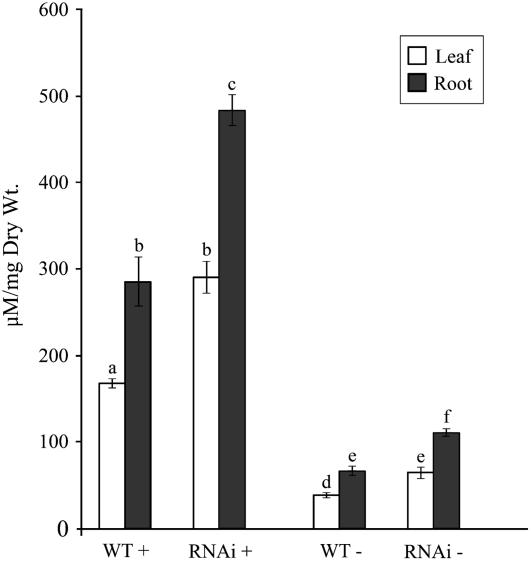
Figure 7.
Increased total P concentration in WRKY75 RNAi plants. Pi concentration in leaves (white bars) and roots (black bars) of wild-type and WRKY75 RNAi plants grown hydroponically with Pi (P+: 250 μm) and without Pi (P−) for 7 d. Error bars indicate se (n = 4), and different letters above the bars represent means that are statistically different (P < 0.05).

