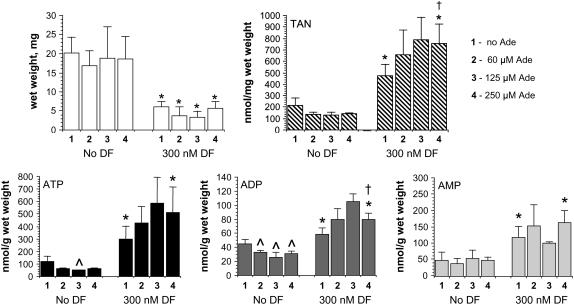
Figure 6.
Dose response of adenine on seedling growth and adenine nucleotide pools in the presence and absence of DF. Protocol as described in the legend to Figure 2, except that the agar medium was supplemented with increasing concentrations of adenine (bar 1, none; bar 2, 60 μm; bar 3, 125 μm; bar 4, 250 μm) alone or in combination with 300 nm DF. Seedling wet weights, top left; total adenine nucleotides (TAN), top right; ATP, bottom left; ADP, bottom middle; AMP, bottom right. Data are expressed as the mean ± sd. *, P < 0.05 when compared to the corresponding no adenine condition in an unpaired two-tailed t test (note: no statistical comparisons using the 60 μm adenine, 300 nm DF and 125 μm adenine, 300 nm DF data were possible because there were only two seedlings in each of these groups). ^, P < 0.05 when compared to the corresponding no adenine condition. †, P < 0.05 when compared to the no adenine, 300 nm DF condition in an unpaired two-tailed t test.

