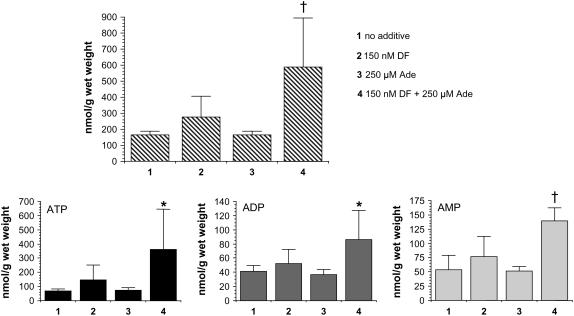
Figure 8.
Synergistic effect of adenine and DF on adenine nucleotide pools in Arabidopsis seedling tissue. Data generated from the seedlings in Figure 7. Total adenine nucleotides (TAN), top; ATP, bottom left; ADP, bottom middle; AMP, bottom right. Bar 1, No additive; bar 2, 150 nm DF; bar 3, 250 μm adenine; bar 4, 150 nm DF + 250 μm adenine. Data expressed as the mean ± sd, n = 6. *, P < 0.05 when compared to all other conditions except for the 150 nm DF alone condition in an unpaired two-tailed t test; †, P < 0.05 when compared to all other conditions in unpaired two-tailed t tests.

