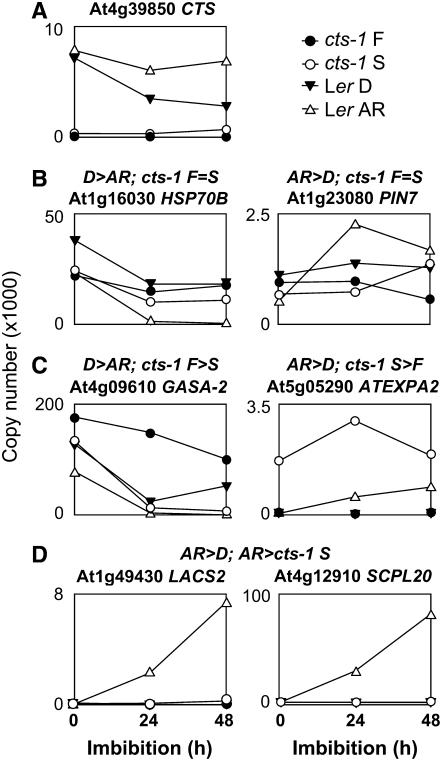
Figure 5.
Gene expression profiles during 48 h following the initiation of imbibition for Ler and cts-1 seeds. Quantitative RT-PCR analysis was carried out using RNA obtained from Ler D and AR and cts-1 S and F seeds imbibed on WA over 48 h. AGI codes and names of encoded proteins are indicated for each transcript. In each case, the expression characteristics of genes in transcriptome datasets at 24-h imbibition are given as titles above graphs. A, Expression of CTS. B, Transcripts showing no change in expression in cts-1 S or F seeds. C, Transcripts differentially regulated in cts-1 S or F seeds. D, Transcripts showing highly induced expression in Ler AR seeds only.

