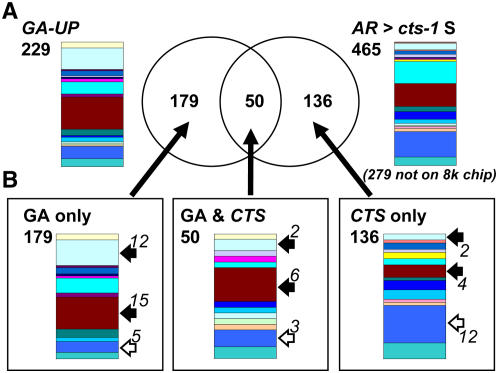
Figure 7.
Comparison of transcriptomes up-regulated by GA4 treatment of ga1-3 seeds and up-regulated in Ler in comparison to cts-1. A, Venn diagram resulting from comparison of GA4 up-regulated gene set (229 genes) with the Ler AR > cts-1 S gene set (465 genes, 279 not on the Affymetrix 8K Genechip). Transcriptome dataset for GA4 treatment of ga1-3 seeds (GA up-regulated) was obtained from Ogawa et al. (2003). Differential gene expression is represented by Venn diagrams. Original developmental signatures and total numbers of genes from these gene sets are shown next to the Venn diagram. Numbers of genes represented in both gene sets are shown within the intersections of the two sets. B, Representations of the developmental signatures of genes from the different Venn diagram sets. Specific functional groups are highlighted with white (increased representation in the CTS set) or black (increased representation in the GA set) arrows. Numbers next to arrows indicate absolute numbers of genes in each functional category of each set. Percentage of genes identified using the TAGGIT workflow in each comparison are given in Supplemental figures. Colors correspond to functional categories shown in Figure 3.

