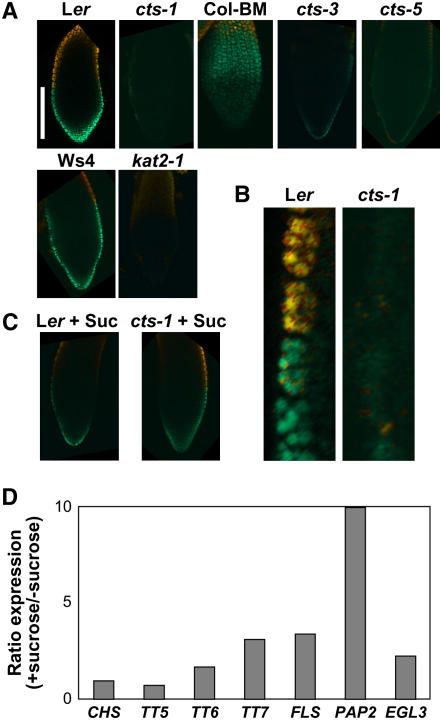
Figure 9.
Visualization of flavonoid accumulation in 24-h imbibed radicles of mutant and wild-type seeds. Orange fluorescence corresponds to quercetin-DPBA, green fluorescence to kaempferol-DPBA, and yellow fluorescence to colocalization of flavonoids. Respective wild-type seedlings are shown next to mutants (Ler, cts-1; Col-BM, cts-3, 5; Ws4, kat2-1). A, Bar represents 100 μm. B, Closeup of epidermis of Ler and cts-1. C, Visualization of flavonoids in Ler and cts-1 seed radicles incubated in the presence of 0.5% Suc. D, Quantitative RT-PCR analysis of flavonoid-associated gene expression in cts-1 seeds imbibed 24 h on WA in the presence of Suc (germination after 7 d: +Suc 11%, −Suc 0%).

