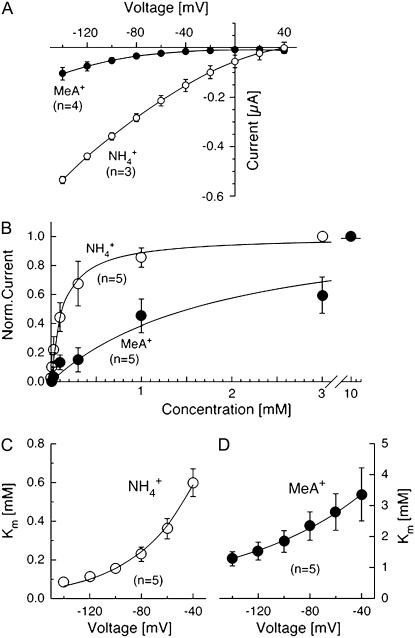
Figure 2.
Functional characteristics of AtAMT1;2 in Xenopus oocytes. A, Current-voltage plot of currents by AtAMT1;2 induced by ammonium (1 mm, white circles) and MeA (1 mm, black circles). B, Saturation of AtAMT1;2 by NH4+ (white circles) and MeA+ (black circles). C and D, Voltage dependence of the saturation constants for NH4+ (C) and MeA+ transport (D).

