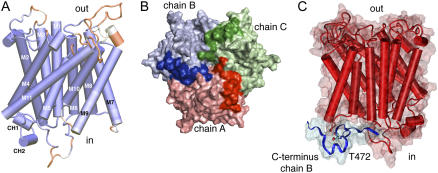
Figure 5.
A homology model of AtAMT1;2 predicts interactions by the C terminus. A, Side view of a homology monomer model of AtAMT1;2 based on EcAmtB and AfAMT-1. Deviations in the structure from its templates are colored in red, and closely resembling structures are given in dark blue. The first 53 amino-terminal amino acids and the final 34 cytosolic amino acids have no correlation in the structure of AfAMT-1 and were removed for clarity. The transmembrane helices are numbered (M1–M11) and the two short C-terminal helices, CH1 and CH2, are indicated at the cytoplasmic side. B, View from the cytosolic side on surface and cartoon representations of the trimeric homology model. Chain A (red), chain B (blue), and chain C (green) are shown with the C terminus in darker color. C, Side view from a different angle of monomer chain A in red and the C terminus of the neighboring chain B in blue. Thr-472 from chain B is explicitly shown.

