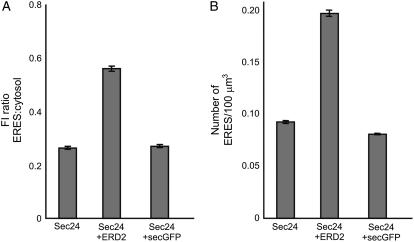
Figure 4.
Quantification of the ERD2-mediated increase in fluorescence intensity and number of ERES. A, Quantification of the YFP-Sec24 fluorescence intensity at ERES relative to that in the cytosol, shown as a ratio, indicates that in the presence of ERD2-GFP, the fluorescence intensity at ERES increases in comparison to that in cells expressing YFP-Sec24 alone. However, no increase in fluorescence intensity is observed on coexpression of secGFP, a soluble cargo protein. Fluorescence was measured for at least 10 ERES and cytosol areas per cell in 150 cells, giving at least 1,500 ERES and 1,500 cytosol measurements for each combination of markers. B, Number of ERES per 100 μm3 in cells expressing YFP-Sec24 in the presence of ERD2-GFP increases in comparison to cells expressing YFP-Sec24 alone. However, coexpression of the soluble marker secGFP has no effect on the number of ERES per 100 μm3. Error bars represent se of the mean.

