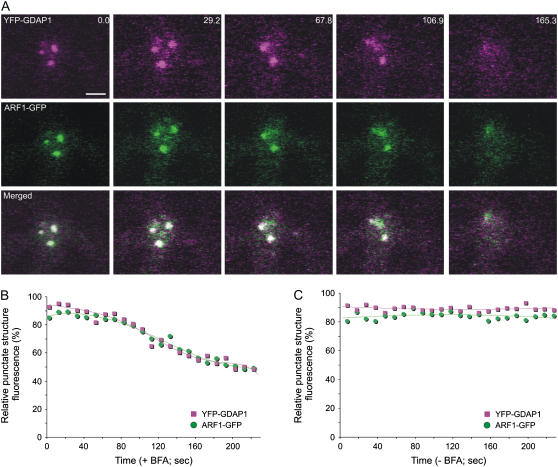
Figure 3.
BFA treatment induces the simultaneous redistribution of YFP-GDAP1 and ARF1-GFP. A, Time-lapse confocal micrographs demonstrate the effect of BFA treatment on a live tobacco epidermal cell coexpressing YFP-GDAP1 and ARF1-GFP. The distribution of both markers was clearly visible on punctate structures before BFA treatment. Representative images are shown at various time points throughout the BFA treatment. There was variability observed in the response rate of ARF1-labeled structures within a given cell. In addition, temporal inconsistencies in response to BFA treatment were also observed between cells, in agreement with the observations of Ritzenthaler et al. (2002). However, the trend always remained consistent in that both ARF1 and GDAP1 were simultaneously released into the cytosol from the same structures. The time(s) is indicated in the top right corner. The first image in the sequence (labeled 0.0) was taken after a 45-min pretreatment with latrunculin B and a subsequent incubation of 5 min with BFA. Scale bar = 2 μm. The fluorescence of the punctate structures relative to that of the cytosol was measured for both YFP-GDAP1 and ARF1-GFP in each frame of the time lapse with (B) and without (C) BFA treatment. The RPSF is given as a percentage of the ratio between fluorescence intensity values (arbitrary units) measured in the punctate structure and the sum of intensity values for the cytosol and punctate structure (see “Materials and Methods”).

