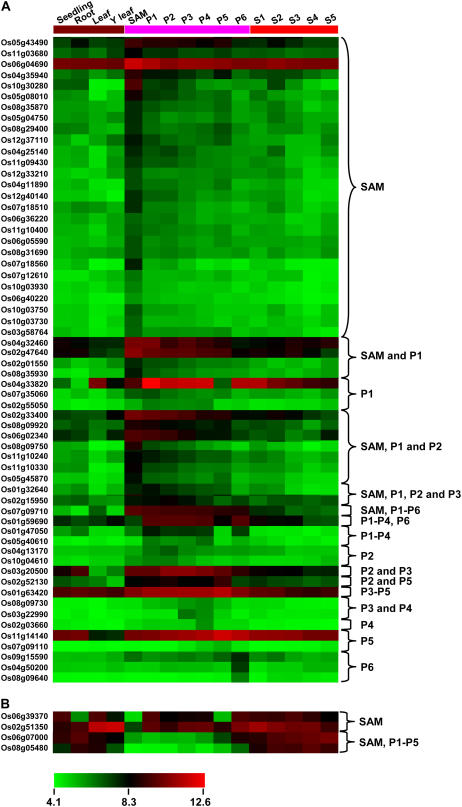
Figure 4.
Expression profiles of rice F-box protein-encoding genes differentially expressed during panicle development. Expression profiles of 60 up-regulated (A) and four down-regulated (B) F-box protein-encoding genes in SAM or any stage of panicle development (P1–P6) as compared to vegetative reference tissues/organs (seedling, root, mature leaf, and Y leaf) and seed developmental stages (S1–S5) are presented. The average log signal values of F-box protein-encoding genes in various tissues/organs and developmental stages (mentioned at the top of each lane) are presented by cluster display. The color scale (representing log signal values) is shown at the bottom.

