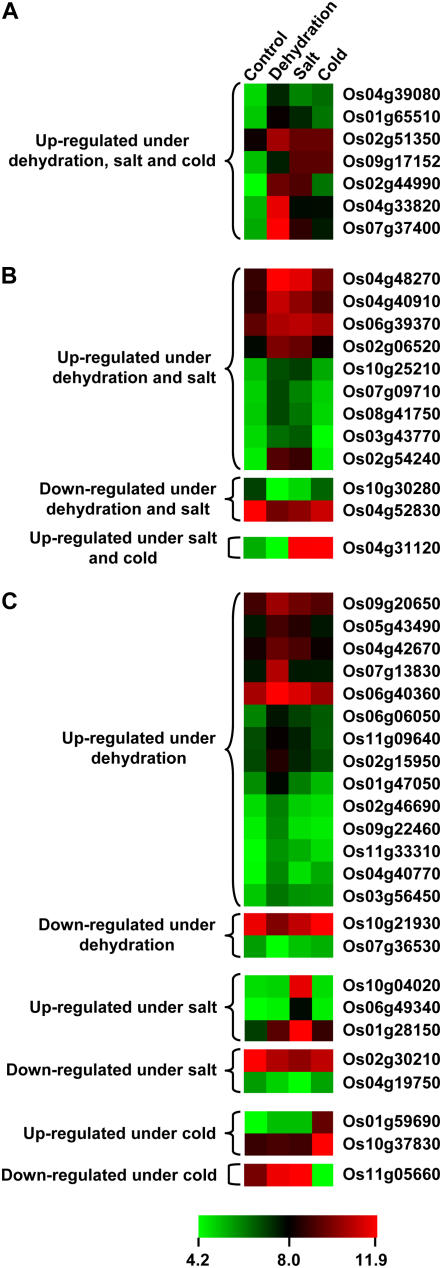
Figure 7.
Expression profiles of rice F-box protein-encoding genes differentially expressed under abiotic stress conditions. Expression profiles of F-box protein-encoding genes differentially expressed under all three (A), any two (B), and specific (C) stress condition(s) as compared to the control seedlings are presented. The average log signal values of F-box protein-encoding genes under control and various stress conditions (mentioned at the top of each lane) are presented by cluster display (values are given in Supplemental Table S10). Only those genes that exhibited 2-fold or more differential expression with a p value of less than or equal to 0.05, under any of the given abiotic stress conditions are shown. The color scale (representing log signal values) is shown at the bottom.

