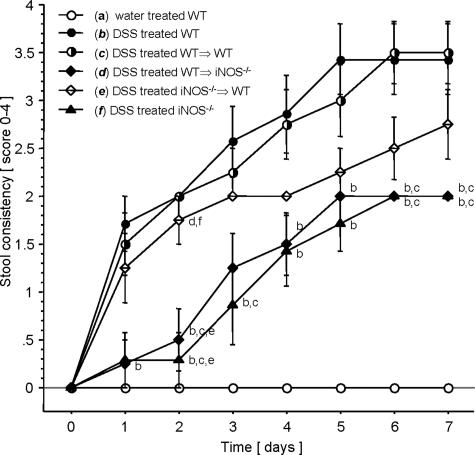
Figure 4.
Stool score throughout 7 days of oral treatment with water in WT controls (n = 8) or 2.5% DSS in WT mice (n = 7), WT⇒WT, WT⇒iNOS−/−, iNOS−/−⇒WT bone marrow chimeric mice (n = 8 per group), and iNOS−/− mice (n = 7). Mean ± SEM. For each time point, the letters indicate a significant difference (P < 0.05) versus the group indicated by the same letter.

