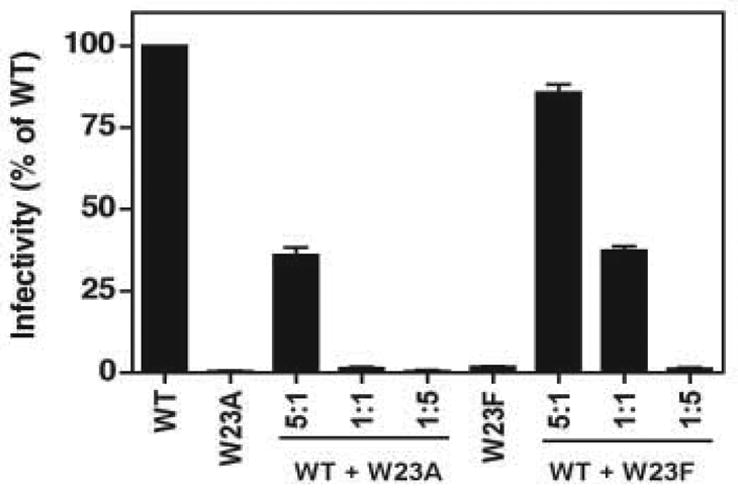
Fig. 4.

Dominant negative activity of W23A and W23F. HeLa cells were transfected with 5 μg of the following plasmid DNAs: WT alone, W23A or W23F alone, and 5:1, 1:1, and 1:5 mixtures of WT and either W23A or W23F. Virus stocks were harvested, normalized for RT activity, and used to infect LuSIV cells (Roos et al., 2000). The values in the bar graph represent infectivity as the percentage of the WT value, which was set at 100%. Here as well as in Figs. 5 and 6, error bars indicate the standard deviation from at least three independent experiments.
