
Figure 4.
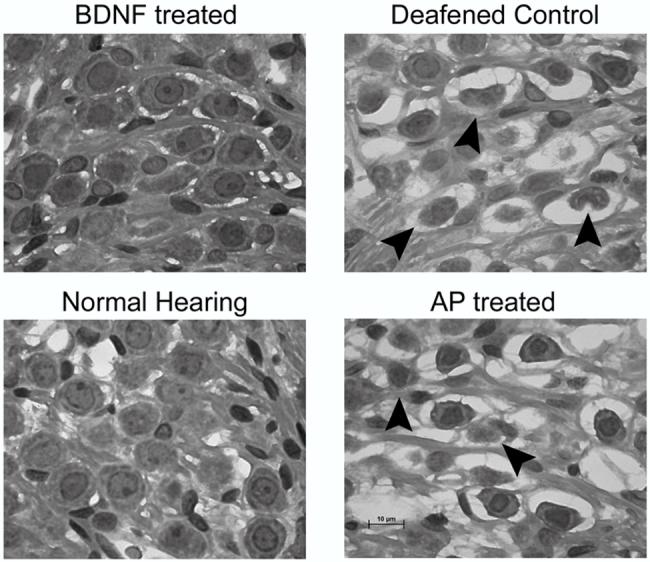
Higher power photomicrographs illustrating representative SGN morphology in each of the groups studied. Arrowheads illustrate a number of SGNs that are in the process of degeneration. Scale bar = 10 μm
Official websites use .gov
A
.gov website belongs to an official
government organization in the United States.
Secure .gov websites use HTTPS
A lock (
) or https:// means you've safely
connected to the .gov website. Share sensitive
information only on official, secure websites.
Higher power photomicrographs illustrating representative SGN morphology in each of the groups studied. Arrowheads illustrate a number of SGNs that are in the process of degeneration. Scale bar = 10 μm