
Figure 5.
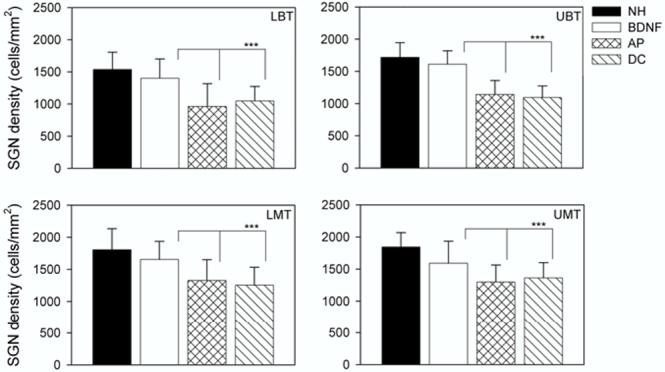
SGN density (cells/mm2) as a function of treatment group. The plot illustrates the mean (+ 1 standard deviation) for each cohort across the four cochlear turns examined. All deafened cohorts (BDNF; AP and DC) had been deafened for a total period of 6 weeks. There was no statistically significant reduction in cell density for the BDNF cohort compared with the NH controls across the basal-most three cochlear regions, although there was a significant reduction for the BDNF cohort in the UMT (Table 2). Both the NH control and BDNF groups exhibited statistically significant increases in SGN density compared to the AP and DC cohorts across all turns examined (Table 2).