
Figure 1.
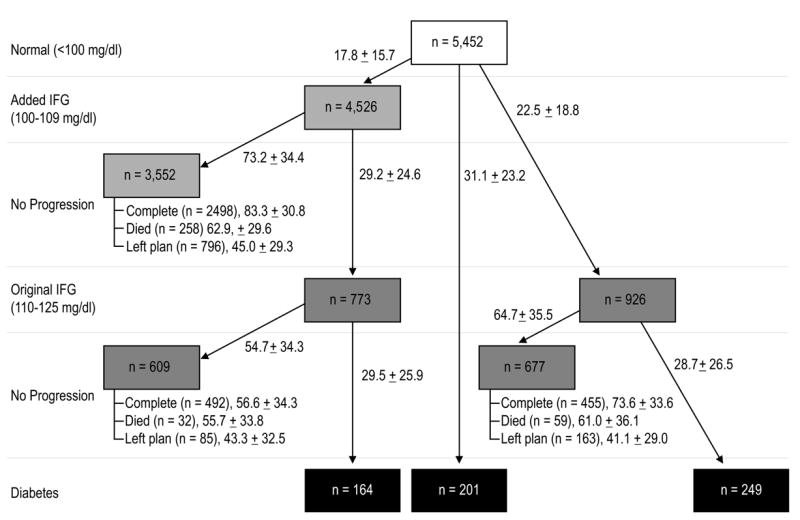
Progression from normal fasting plasma glucose to stages of Impaired Fasting Glucose to Type 2 Diabetes. Mean months (± standard deviation) from stage to stage for progressers are displayed along each arrow. For those who do not progress, mean months (sd) of follow-up are displayed along the arrows.