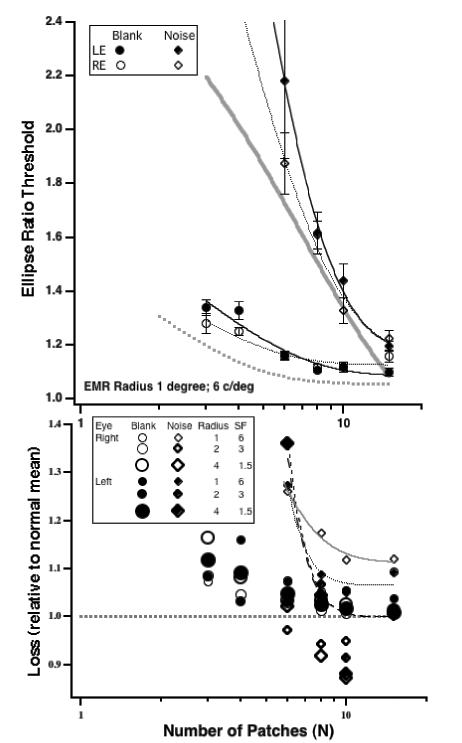
Fig. 12.

Top. Ellipse ratio thresholds as a function of N for each eye of observer ER who has a history of early onset strabismus but good acuity in each eye. No-noise (circles) or in-noise (diamonds). Circle radius was 1 deg. The thick gray curves are the fits to the normal data from Fig. 3.
Bottom: The loss (in each eye) as a function of the number of elements relative to thresholds the normal control group (open circles - on a blank screen; solid diamonds – in noise). Data for 3 radii (coded by symbol size).
