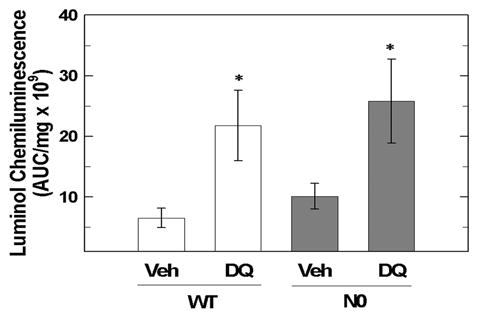
Figure 3.

Isolated mitochondria from WT and N0 cells possess similar capacity to generate ROS. Mitochondria isolated from WT and N0 cells were exposed to 50 μM DQ or vehicle for 40-min and luminol chemiluminescence monitored. Mean area under the curve (AUC) readings were normalized to the protein content of the isolated mitochondria. Values represent the mean ± SE of 4 independent experiments. * p < 0.05, compared to respective vehicle treated group.
