
Figure 4.
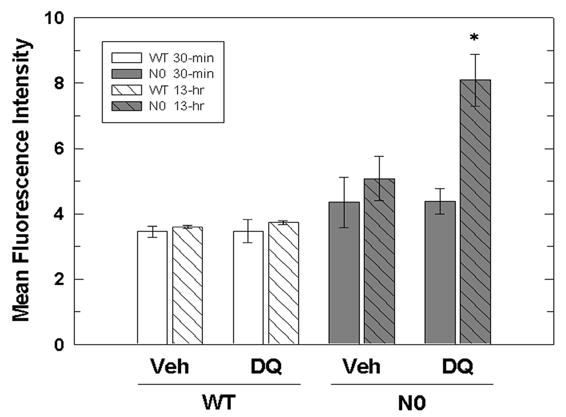
Intracellular ROS levels in N0 cells increase with duration of DQ treatment. WT and NO cells were treated with 50 μM DQ or vehicle for 30-min (solid) and 13-hr (hatched). The media was replaced with media containing 50 μM DQ and 10 μM CM-DCFDA and the cells were incubated for 30 min. DCF fluorescence of viable cells was determined by flow cytometry. The data are expressed as mean fluorescence intensity of viable cells. Values represent the mean ± SE of three independent experiments. * p < 0.05 compared to WT and N0 vehicle-treated groups.