
Figure 3.
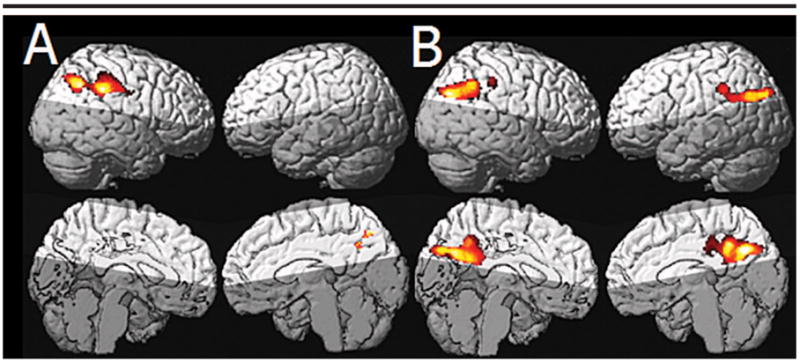
A, Statistical parametric maps show regional hypoperfusion in the MCI group (relative to the CN group) after accounting for global perfusion. A lower voxel-level threshold of P < .01 was used. The cluster of significant hypoperfusion is located in the right parietal lobe, in a region very similar to that most affected in the AD group. B, Statistical parametric maps show hypoperfusion in the AD group relative to the MCI group with correction for PVEs and adjusted for global perfusion. The right parietal regions seen in A are not seen in B; this suggests that hypoperfusion in this region may reflect early disease effects in the MCI group.