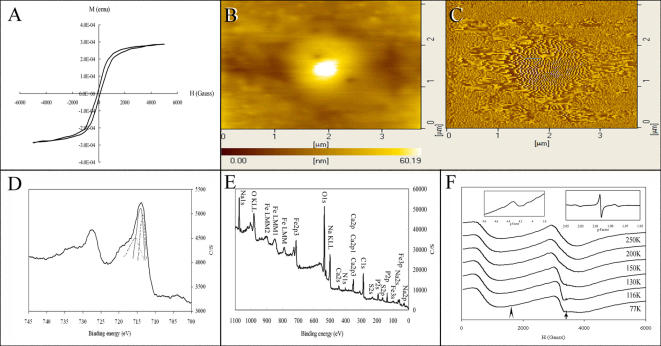
Figure 3.
The magnetic properties of IGs determined by magnetic-determining techniques. (A) An averaged magnetization curve of SQUID from the purified IGs at 300°K for six runs. (B) An image of AFM from one of the purified IGs. (C) An image of MFM from one of the purified IGs. (D) A spectrum of ESCA from the purified IGs. The left thin line shows the Fe(2p1/2) of FeOOH. The middle thin line shows the Fe(2p3/2) of Fe2O3. The right thin line shows the Fe(2p1/2) of FeO. (E) A photoelectron spectrum of elemental composition of ESCA from the purified IGs. (F) Typical X-band resonance spectra from the purified IGs at different temperatures. Right inset shows a magnified image from the arrow. Left inset shows a magnified image from the arrowhead.

