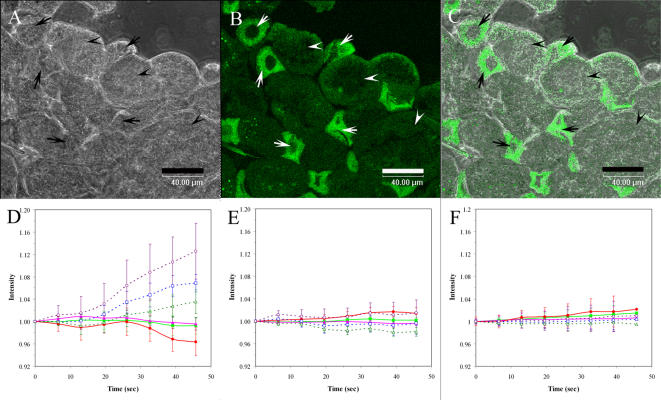
Figure 5.
The images of increase of [Ca+2]i in the live trophocytes obtained by confocal microscope. (A) The image of trophocytes and fat cells under confocal microscope. Trophocytes (arrowhead). Fat cells (arrow). Scale bar, 40 µm. (B) The image of trophocytes and fat cells labeled fluo 4 under confocal microscope. Trophocytes (arrowhead). Fat cells (arrow). Scale bar, 40 µm. (C) The merge of Figure A and Figure B. Scale bar, 40 µm. (D) The fluorescence intensity of trophocytes (○), fat cells (Δ), and trophocytes and fat cells together (□) with 1 Gauss magnetic field. The fluorescence intensity of trophocytes (•), fat cells (▴) and trophocytes and fat cells together (▪) without 1 Gauss magnetic field as control. (E) The fluorescence intensity of trophocytes (○), fat cells (Δ), and trophocytes and fat cells together (□), which is inhibited by colchicine and with 1 Gauss magnetic field. The fluorescence intensity of trophocytes (•), fat cells (▴) and trophocytes and fat cells together (▪), which is inhibited by colchicine without 1 Gauss magnetic field as control. (F) The fluorescence intensity of trophocytes (○), fat cells (Δ), and trophocytes and fat cells together (□), which is inhibited by latrunculin B and with 1 Gauss magnetic field. The fluorescence intensity of trophocytes (•), fat cells (▴) and trophocytes and fat cells together (▪), which is inhibited by latrunculin B without 1 Gauss magnetic field as control.

