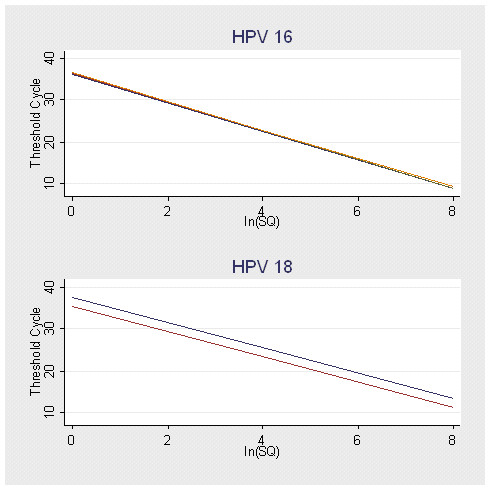
Figure 1.

Comparison of Standard Curves from Repeated Assays by HPV Type. This figure is a graphical comparison of the standard curves from each of the HPV 16 and HPV 18 assays. There were four assays performed for HPV 16 and two for HPV 18. The type-specific curves were not statistically different from one another, and those for HPV 16 are graphically identical. (Note: ln(SQ) = natural log of starting quantity.)
