
Figure 2.
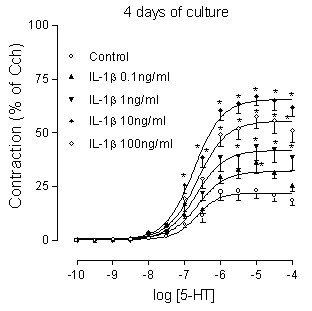
Concentration-response curves for IL-1β effects on the 5-HT response. Tracheal segments cultured for 4 days in the presence of different concentrations of IL-1β (0.1, 1, 10, 100 ng/ml). Each data point is derived from 6–16 experiments and represented as the mean ± S.E.M. Statistical analysis was performed with two-way ANOVA with Bonferroni post-test to compare the two corresponding data points at each concentration of the two curves. *P < 0.05, compared with control.