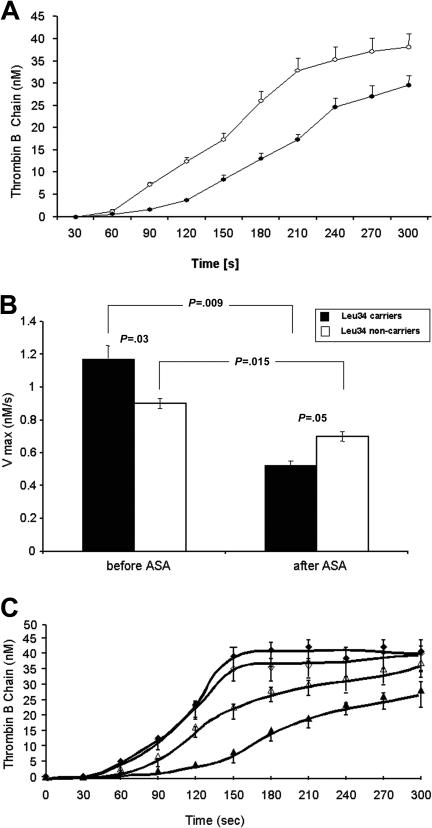
Figure 2.
The effect of aspirin of select populations using a microvascular injury model. (A) Quantitative analysis of the generation of a-thrombin B-chain (circles) in bleeding time blood from 12 individuals (mean ± SEM).30 This product, estimated by densitometry and comparison to standards, is presented as a function of time (seconds). Concentration of thrombin B-chain before (○) and after 7-day aspirin (ASA, 75 mg/d) treatment (●). (B) The maximal velocities of activated factor XIII A subunit (FXIIIA) removal from bleeding time blood (mean ± SEM) in the Leu34-negative subjects (n = 23) and Leu34 carriers (n = 14) both prior to and following 7-day aspirin (ASA, 70 mg/d) treatment.30 (C) Quantitative analysis of thrombin B-chain generation showing concentrations of thrombin B-chain in 12 PlA1A1 subjects (triangles) and in 12 PlA2 carriers (diamonds) before (open symbols) and after 7-day aspirin (70 mg/d) treatment (closed symbols).34 Values are plotted as mean ± SEM.

