Figure 5.
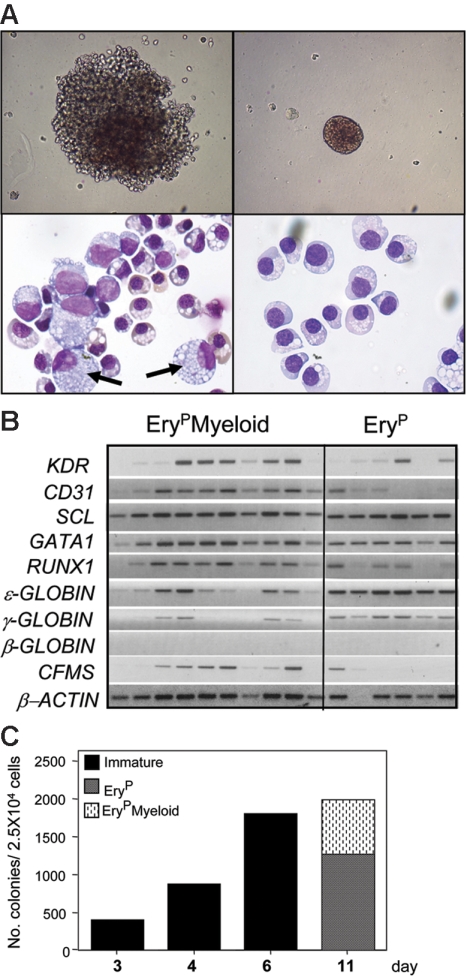
Development of 2 populations of hemangioblasts. (A, top row) Photograph of an 11-day-old EryPMyeloid–restricted (left) and EryP-restricted (right) blast colony (original magnification, × 200). (A, bottom row, left) Photograph of erythrocytes and macrophages (arrows) from an individual EryPMyeloid blast colony, and (right) erythroid cells from a pool of EryP blast colonies. Original magnification: × 1000. (B) Expression analyses of 10 individual EryPMyeloid and 6 EryP blast colonies. (C) Kinetics of blast colony development from KDR+ cells isolated from day-4 EBs.

