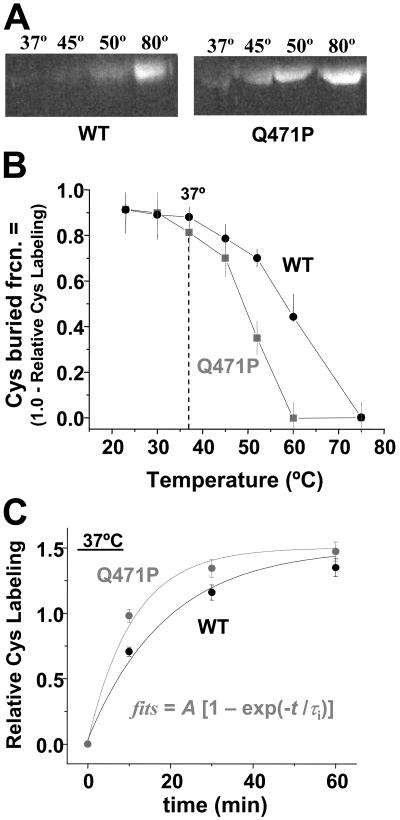
Figure 4.
Cysteine labeling compared with temperature for mutant and WT. (A) SDS-PAGE followed by fluorescence imaging of IAEDANS-labeled proteins illustrates an increase in Cys labeling at lower temperatures for the mutant. (B) Unlabeled Cys compared with temperature after 60-minute reaction. Splayed curves resemble the unfolding curves of Figure 2, with significant differences in labeling at temperatures higher than 30°C. (C) IAEDANS reaction kinetics of WT and Q471P with associated fits. First-order reaction rate fits to the data demonstrate a 1.9-fold faster rate of reaction for Q471P than for WT.

