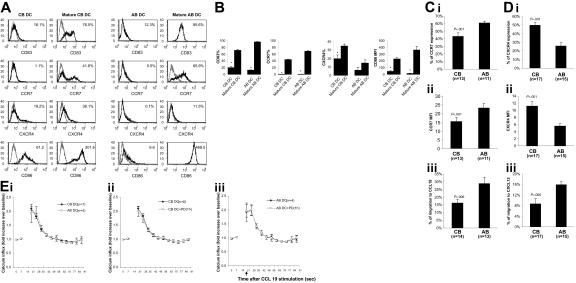
Figure 1.
Comparison of phenotype, migration, and chemokine receptor expression by mature CB and AB DCs. (A) LPS induced phenotypic maturation of both CB and AB DCs. One representative histogram of CB and AB DCs before and after LPS-induced maturation is shown. Cells were stained with indicated molecules (black histogram) and isotype controls (gray histogram). Expression levels of indicated molecules (percentage of positive cells for CD83, CCR7, and CXCR4, and median fluorescence intensity for CD86) are shown in the upper right corner. (B) Average expression level of indicated molecules plus or minus the standard error of the mean (SEM) from 3 independent experiments is shown in panel A. (C) Fewer mature CB DCs express CCR7 (i) and mature CB DCs express a lower CCR7 median fluorescence intensity (MFI) (ii) on the surface, and mature CB DCs migrate with significantly lower efficiency to CCL19 (iii). (D) Mature CB DCs have a higher percentage of CXCR4+-expressing cells (i) and higher CXCR4 MFI (ii) on the surface than mature AB DCs, but migrate at significantly lower efficiency to CXCL12 (iii). In panels C and D, mature CB and AB DCs were tested in Transwell chemotaxis assays for the ability to migrate toward medium alone or toward medium supplemented with 100 ng/mL CCL19 or CXCL12 as indicated. (E) CCL19 induces calcium influx in CB DCs as well as in AB DCs (i), a process independent of ERK activation in both CB DCs (ii) and AB DCs (iii). In panels Eii and Eiii, cells were pretreated with PD98059 for 1 hour before adding CCL19.

