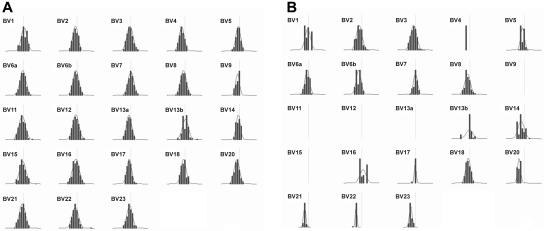
Figure 2.
Spectratype analysis of patient TCR Vβ repertoire. Expression of the indicated Vβ families in (A) healthy volunteer and (B) patient cells was assessed by PCR amplification and run-off reaction. Depicted are density peak histograms for each Vβ family with CDR3 sizes centered around a CDR3 length = 30 bp (vertical line) shown on the x-axis, and peak fluorescence intensity on the y-axis. The calculated Kullback-Leibler divergence (DKL), a statistical measure of divergence from maximum diversity, was 0.05 for healthy volunteer histograms and 0.25 for patient histograms. The higher patient DKL indicates a less diverse (more oligoclonal) distribution of peaks.

