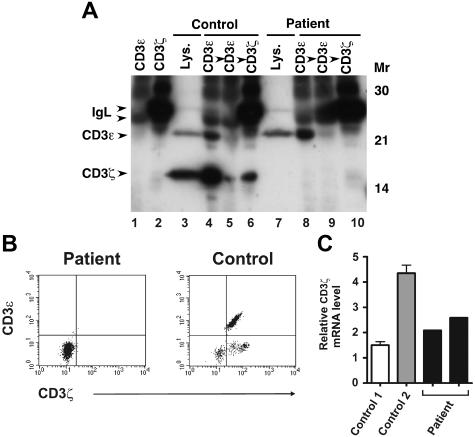
Figure 4.
Analysis of CD3ζ protein and mRNA expression in patient T cells. (A) Patient and healthy volunteer sorted CD3ε+ PBMCs were lysed in digitonin lysis buffer and either sequentially immunoprecipitated with 2 rounds of anti-CD3ε Ab followed by anti-CD3ζ Ab, or subjected to direct immunoblotting (lanes 3 and 7). Lysates were immunoblotted with anti-CD3ζ and anti-CD3ε Abs. Lanes 1 and 2 contain anti-CD3ε– or anti-CD3ζ–coated beads incubated with lysis buffer alone, as indicated. (B) Patient and healthy volunteer PBMCs were first stained with PerCP-labeled anti-CD3ε to assess cell surface CD3ε expression. The cells were then fixed and permeabilized, stained with FITC-labeled anti-CD3ζ Ab, and analyzed by flow cytometry. Shown are 2-color plots of surface CD3ε and intracellular CD3ζ expression. (C) Patient CD3ε+ cells were obtained from 2 different sorted PBMC samples (from different dates). Healthy volunteer sorted CD3ε+ PBMCs were isolated from 2 unrelated individuals (control 1, control 2). cDNA was prepared from sorted cells and CD3ζ transcripts were quantified by SYBR green real-time PCR. Levels of CD3ζ mRNA were normalized to those of β-actin for each sample. Values represent mean ± SEM of duplicate determinations.

