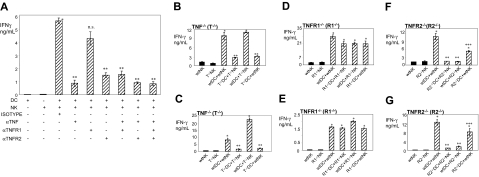
Figure 6.
Interaction between DC-TNF and NK-cell TNFR2 mediates increased secretion of IFN-γ by NK cells in DC–NK-cell crosstalk. (A) Disruption of TNF-TNFR2 but not TNF-TNFR1 interplay impairs DC–NK-cell cross-stimulation of IFN-γ secretion. cmDCs and caNK cells were cultured either alone or together in the presence of isotype control mAb (isotype), anti-TNF (αTNF), anti-TNFR1 (αTNFR1), and/or anti-TNFR2 (αTNFR2) mAb for 24 hours. Following these incubations, cell-culture–conditioned media were assessed by IFN-γ ELISA. Presented data are from 1 representative experiment of 4 similar experiments performed. They are means ± SD of triplicates IFN-γ nanograms per 0.5 × 10⁶ cells per milliliter. Single asterisk indicates significant increase of IFN-γ secretion in DC+NK-cell cocultures treated with isotype control mAbs in comparison with DC or NK-cell cultures alone. Double asterisks indicate significant decrease of IFN-γ secretion in mAb-treated DC–NK-cell cocultures in comparison with isotype control or anti-TNFR1 mAb-treated DC–NK-cell cocultures. ns indicates nonsignificant difference between anti-TNFR1– and isotype control mAb-treated DC+NK-cell cocultures. (B-C) DC TNF, but not NK-cell TNF, is required for DC stimulation of IFN-γ secretion by NK cells. (D-E) Neither NK-cell nor DC TNFR1 is required for DC induction of IFN-γ secretion by NK cells. (F-G) NK-cell TNFR2, but not DC TNFR2, is required for most DC induction of IFN-γ secretion by NK cells. Wild-type (wt) or TNF−/− (B-C), TNFR1−/− (D-E), and TNFR2−/− (F-G) fiDCs and fNK cells (B,D,F) or ciDCs and caNK cells (C,E,G) were cultured for 24 hours in the presence of LPS (both fresh and cultured cells) and/or IL-2 (only fresh cells) either alone or in the following combinations: wild-type+wild-type, gene-deficient+gene-deficient, wild-type+gene-deficient, and gene-deficient+wild-type. After this incubation, cell-culture–conditioned media were assessed by IFN-γ ELISA. The presented data of fresh cells are from one experiment and of the cultured cells from a representative experiment of 2 to 3 similar experiments performed. They represent means ± SD of triplicates IFN-γ nanograms per 0.5 × 10⁶ cells per milliliter. Single asterisks indicate significant increases of IFN-γ in DC+NK-cell cocultures in comparison with DC or NK-cell cultures alone. Double asterisks indicate significant decreases of IFN-γ in TNF−/−DC+TNF−/−NK-cell or TNF−/−DC+wtNK-cell and TNFR2−/−DC+TNFR2−/−NK-cell or wtDC+TNFR2−/−NK-cell cocultures in comparison with wtDC+wtNK-cell or wtDC+TNF−/−NK-cell and wtDC+wtNK-cell or TNFR2−/−DC+wtNK-cell cocultures, respectively. Triple asterisks indicate statistical significance of the small decrease of IFN-γ in TNFR2−/−DC+wtNK-cell cocultures in comparison with wtDC+wtNK-cell cocultures.

