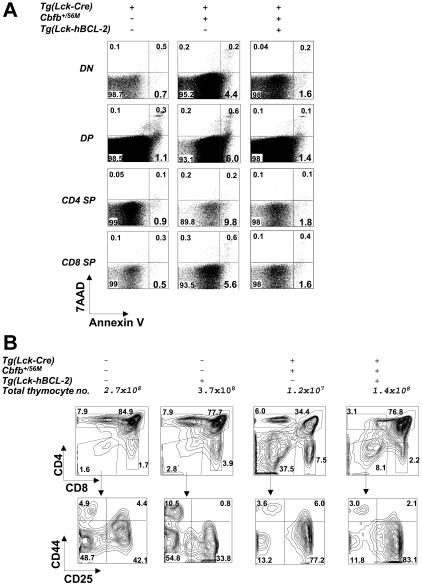
Figure 4.
Increased apoptosis of thymocytes in the Tg(Lck-Cre)/Cbfb+/56M mice. (A) Dot plots of annexin V and 7AAD staining in DN, DP, and CD4 and CD8 SP cells of the Tg(Lck-Cre), Tg(Lck-Cre)/Cbfb+/56M, and Tg(Lck-Cre)/Cbfb+/56M/Tg(Lck-hBcl-2) mice (all littermates). (B) Contour plots of cell surface marker expression on the thymocytes of mice with the genotypes as shown. The total thymocyte numbers for each genotype are also given.

