
Figure 2.
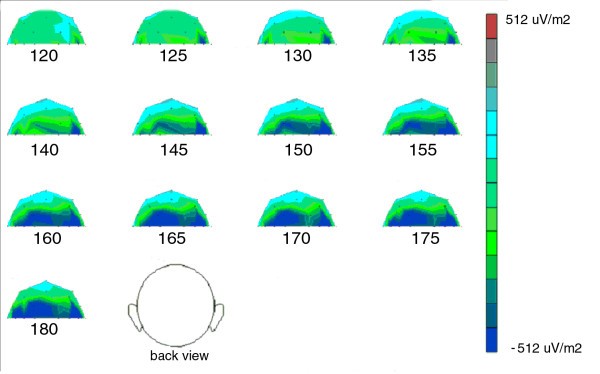
SCD difference maps for N1 (animals-objects). Temporal series of scalp current density difference maps obtained by subtracting brain activity related to man-made objects from activity related to animals every 5 ms during the 120–180 ms post-stimulus interval.