
Figure 6.
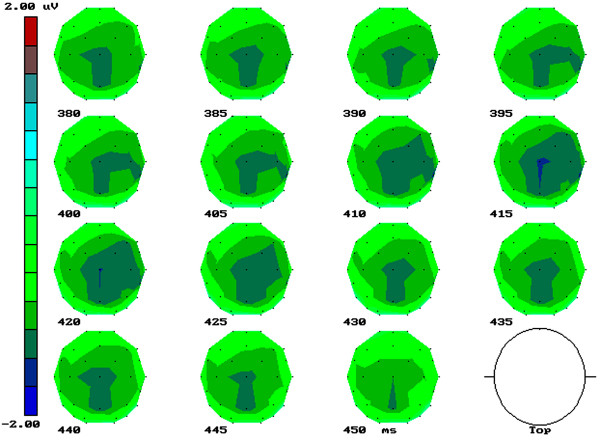
Time series of difference maps in the N4 latency range (380–450 ms) computed by subtracting the scalp voltage distribution of ERPs in response to animals from those in response to objects. The maps show a larger activation in right central-parietal areas during categorization of man-made objects.