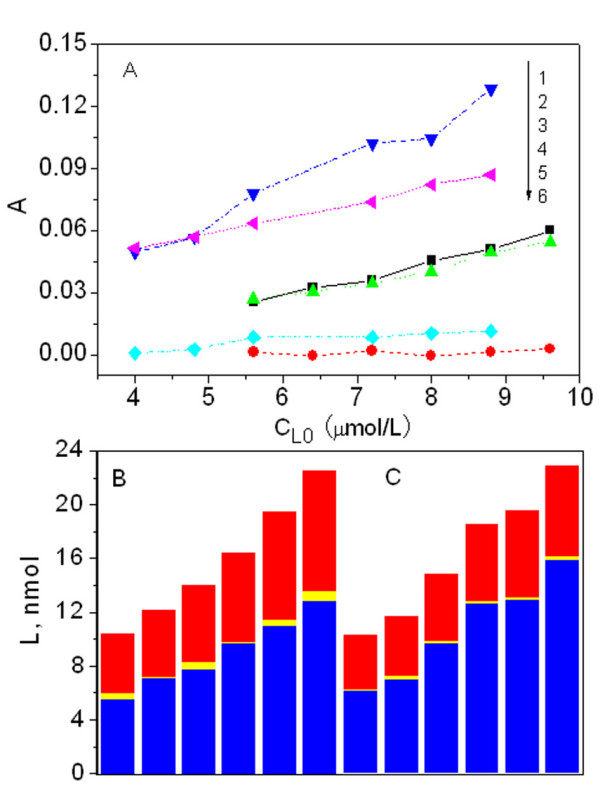
Figure 6.

Spectrophotometric measurements of the solutions containing E. coli and Sudan red compounds. 1: absorption of Sudan IV in extracellular solution; 2: absorption of Sudan IV accumulated in membrane; 3: absorption of Sudan II free in extracellular aqueous medium; 4: absorption of Sudan II accumulated in membrane; 5: absorption of Sudan IV in cytosol; 6: absorption of Sudan II in cytosol. B: distribution of Sudan II in the extracellular solution (red), membrane bilayer (blue) and cytosol (yellow). C: the equivalent information as given in B, but for Sudan IV.
