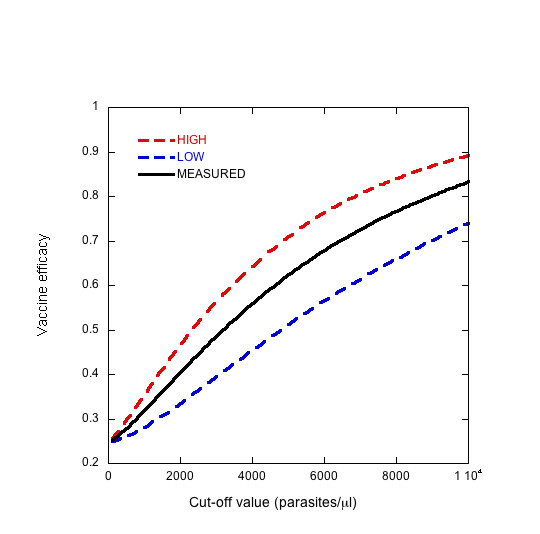
Figure 7.

The observed vaccine efficacy (solid line) and the upper (red dashed line) and lower (blue dashed line) limit of possible outcomes as a function of threshold density based on the uncertainty associated with measurement of parasite density. Frequency of cases by density is assumed to follow the distribution in Figure 6. The upper and lower bounds are calculated using the error model in Figure 4.
