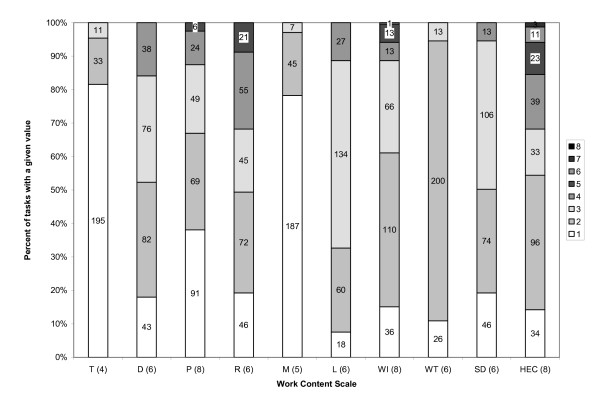
Figure 2.
Percent of tasks assigned a given scale value, by work content scale. Note: T = Things; D = Data; P = People; R = Reasoning; M = Math; L = Language; WI = Worker Instructions; WT = Worker Technology; SD = Worker Interaction; HEC = Human Error Consequence. Numbers in parentheses on the x axis represent the highest possible value on the scale in question; each subsequently higher scale value is represented by an increasingly darker shade of gray in each bar, (see legend for scale values associated with each shade of gray). Numbers inside bars represent the number of tasks assigned the scale value in question.

