FIGURE 2.
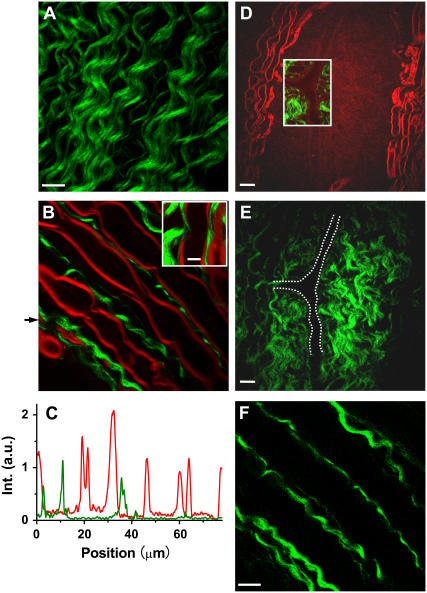
SFG and SHG imaging of helical fibers (green) and CARS imaging of myelin sheath (red) in ex vivo spinal tissues. (A) SFG image near the surface of spinal cord white matter. Scale bar, 10 μm. (B) Overlaid SFG image of fibrils and CARS image of myelinated axons inside spinal cord white matter. (Inset) Overlay of the SFG and CARS images of a node of Ranvier surrounded by astrocyte processes. Scale bar, 5 μm. (C) CARS (red) and SHG (green) intensity profiles along the line indicated by the arrow in B. (D and E) CARS (red) and SFG (green) images of a perivascular area containing a branched blood vessel. (D, inset) Overlaid CARS and SFG images. Scale bar, 20 μm. (E) The blood vessel is indicated by dashed white lines. (F) SHG image of fibrils in the same location of spinal cord white matter as in B. Scale bar, 10 μm. The average laser power for SFG and CARS imaging was around 10 mW at the sample. The average laser power for SHG imaging was 11.2 mW at the sample.

