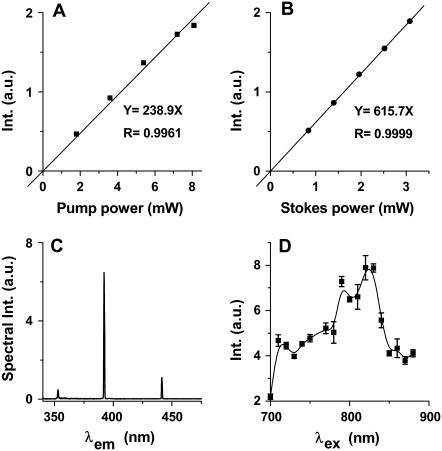
FIGURE 3.
Characterization of the SFG and SHG signals from ex vivo spinal tissues. (A) Linear dependence of SFG intensity on pump laser power with fixed Stokes power at 3.5 mW at the sample. The squares represent the data and the solid line represents linear fit. (B) Linear dependence of SFG intensity on Stokes laser power with fixed pump power at 8.5 mW at the sample. The solid circles represent the data and the solid line represents linear fit. (C) Emission spectra of SHG and SFG produced by two picosecond beams at 705.8 nm (average power 3.96 mW at the sample) and 882.6 nm (average power 1.12 mW at the sample), respectively. (D) SHG excitation profile generated by tuning the 200-fs laser in the region of 700 to 900 nm. The SHG intensity was normalized by the transmission of the microscope components (dichroic mirrors, objective, and filters) and the laser power. The error bar for each point represents the standard error of three measurements.

